
Northern Ireland house prices rose 7.4% in the year to September 2026, taking the standardised average to £207,272. That makes it the fastest riser of the four UK nations, according to the Land and Property Services statistical press notice, published by the Department of Finance with support from NISRA.
However, the headline hides a market running at two speeds. New build homes have now passed their 2007 peak, while resales sit below it. Apartments were the only property type to lose value between quarters. This article walks through the council area figures, the property type split and what it all means for agents advising British, German and Dutch buyers.
Northern Ireland House Prices at 127.6 on the Index
The Northern Ireland house price index for Q3 2026, covering July to September, stands at 127.6. That is up 2.7% on the quarter and 7.4% on the year. The reference period is Q1 2023, so prices are now 27.6% higher than they were then.
Meanwhile, activity was solid. A provisional 5,892 residential properties were sold in the quarter, and that figure will rise as late returns arrive. Agents quoting volumes to clients should treat the number as a floor, not a final count.
Still, the longer view matters for buyers who remember the crash. Prices are 124.8% above the Q1 2013 market bottom, yet still 2.5% below the Q3 2007 peak. In other words, the overall market has more than doubled from its low point but has not quite regained its old high. That gap is small, and on the current pace of growth it is a short distance to close. It also explains why many buyers still see Northern Ireland as reasonable value compared with other parts of the UK.
Armagh Leads With 10.6% as Ards Trails at 3.4%
The council area picture is where the practical detail sits. Armagh City, Banbridge and Craigavon recorded the strongest annual growth at 10.6%. Ards and North Down was the weakest at 3.4%. That is a gap of more than seven percentage points inside one small housing market.
Other areas fell between those poles. Newry Mourne and Down rose 9.7%, Lisburn and Castlereagh 8.5%, Mid Ulster 8.4% and Antrim and Newtownabbey 7.5%. Property prices in Belfast, the capital, rose 7.5%, which puts it in the middle of the range. Further down came Causeway Coast and Glens at 6.9%, Fermanagh and Omagh at 6.5%, Derry City and Strabane at 6.3% and Mid and East Antrim at 5.9%.
Price levels differ just as much. The lowest council average was Mid and East Antrim at £181,122, and the highest was Lisburn and Castlereagh at £244,983. On the index itself, Causeway Coast and Glens is lowest at 121.5 and Derry City and Strabane highest at 135.7. A local growth rate and a local price level tell you different things, so check both before setting an asking price.
Before you set an asking price in any of these districts, do three things:
- Take the annual growth figure for the council area, not the Northern Ireland average.
- Match the property type, because a terrace and a detached house moved at different rates.
- Count the comparable sales that completed in the quarter, since 5,892 sales across 11 council areas leaves some districts with a thin base.
Apartments Fall 1.3% While Every Other Type Rises
Apartments were the only property type to fall between quarters, down 1.3%. Detached homes rose 2.6%, semi-detached 3.5% and terraces 3.0% over the same period.
| Property type | Standardised price | Change on the year |
|---|---|---|
| Detached | £319,158 | 6.3% |
| Semi-detached | £209,953 | 8.9% |
| Terrace | £150,555 | 7.7% |
| Apartment | £147,465 | 3.9% |
| All types | £207,272 | 7.4% |
Apartments still gained 3.9% over the year, so this is a slowdown rather than a collapse. But it is the weakest annual figure of any type, and well below the 7.4% average for all homes. Semi-detached homes led at 8.9%.
A flat and a terrace are not the same asset in a rising market. A terrace at £150,555 sits close to an apartment at £147,465, yet it has risen 7.7% on the year against 3.9%. Buyers choosing between the two at a similar price are effectively choosing between a faster and a slower mover. Agents should say so plainly, because a buyer who understands the trade-off is a better-prepared buyer.
New Builds Sit 10% Above Their 2007 Peak
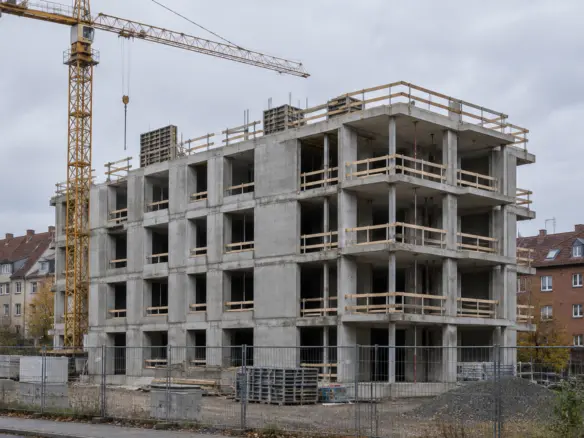
The new build story is the sharpest sign of a two-speed market. New dwellings have a standardised average of £265,429, up 2.7% on the quarter and 8.5% on the year. Those prices are now 10.0% above the Q3 2007 peak.
Existing resold dwellings tell a different tale. Their standardised average is £201,794, up 2.7% on the quarter and 7.2% on the year, and they remain 5.6% below the 2007 peak. The quarterly rise is identical, but the annual gap of 1.3 percentage points has been enough to push new build through the old high while resales have not.
There is a caution on the data. The index is built on HMRC stamp duty returns, so it measures completed sales, not asking prices. New dwellings take longer to record because their characteristics are added later, so the new build series is more volatile. Treat a single quarter of new build movement with care, and look at the direction over several releases before drawing firm conclusions.
What the Numbers Mean for Buyers and Agents
The figures translate into a few clear habits for anyone working the Northern Ireland housing market.
- Quote the council figure rather than the national one. A 3.4% year in Ards and North Down and a 10.6% year in Armagh, Banbridge and Craigavon cannot sensibly be averaged into one story.
- Treat apartments as a negotiation. With the type down 1.3% on the quarter and the slowest annual grower, buyers have room to ask for more.
- Use the 5.2 times earnings ratio in client conversations. The ratio of median house sale price to median annual gross earnings was 5.2 in 2026, against 4.9 in 2025 and 9.1 at the 2007 peak.
- Tell sellers that new build comparables carry a premium. A resale priced off a new build neighbour will struggle to hold that number.
The earnings ratio is the useful answer to any buyer who says prices look expensive. It has crept up from 4.9 to 5.2, so affordability is tightening, but it is far from the 9.1 reached before the crash. For wider context, our piece on the income ratio compares how this looks across Europe.
Where Northern Ireland Sits in the UK Market
The HM Land Registry UK House Price Index for September 2026 puts the Northern Ireland result in context. The average UK house price was £273,000, up £3,000 on a year earlier, though it fell 0.5% between August and September.
Northern Ireland, at £207,000 and up 7.4% on the year to Q3 2026, outpaced every other nation. England averaged £293,000, up 0.8%. Wales stood at £215,000, up 1.8%, and Scotland at £198,000, up 2.3%. The Northern Ireland average now sits just above Scotland.
Volumes agree with prices. Northern Ireland transactions rose 2.1% on the year to Q3 2026. Readers tracking the wider picture can compare this with our earlier house price index coverage, and look ahead through the latest sales expectations from surveyors.
Frequently Asked Questions About Northern Ireland
What is the average house price in Northern Ireland?
The standardised average house price in Northern Ireland is £207,272 for Q3 2026. That is up 2.7% on the quarter and 7.4% on the year. Averages vary by council area, from £181,122 in Mid and East Antrim to £244,983 in Lisburn and Castlereagh.
What does the 7.4% figure measure?
It is the annual change in the Northern Ireland house price index for Q3 2026, covering July to September. The index is built on HMRC stamp duty returns, so it reflects completed sales, not asking prices. The quarterly change over the same period was 2.7%.
Why did apartments fall in the quarter?
Apartments were the only property type to decline between quarters, falling 1.3%. They still rose 3.9% over the year to a standardised £147,465, but that is the weakest annual gain of any type. Semi-detached homes grew fastest at 8.9%.
How do new build prices compare with resales?
New dwellings average £265,429, up 8.5% on the year. Resales average £201,794, up 7.2%. New build is the more volatile series because characteristics are added later, so treat single quarters with care. Both rose 2.7% on the quarter.
Are prices above the 2007 peak?
Overall, no. Prices are 2.5% below the Q3 2007 peak. New builds are 10.0% above it, while existing resold dwellings remain 5.6% below. The earnings ratio of 5.2 is far below the 9.1 recorded at the 2007 peak.