


The average British home was worth £273,000 in August, 0.9% more than a year earlier and 0.3% more than in July, according to the UK House Price Index that HM Land Registry published today, 21 October. Sales thinned out alongside it: an estimated 95,000 homes changed hands in August, 1.9% fewer than a year before and 1.5% fewer than in July.
For anyone selling in Britain to buy in Spain, Portugal, Italy or France, the index is only half of the arithmetic. The other half is the exchange rate, and sterling has gained 3.3% against the euro over the past twelve months. Put the two together and the average British home is worth 4.2% more in euros than a year ago, which is almost exactly the 4.0% that euro area house prices rose in the same period.
What the August index says about British equity
Annual growth eased to 0.9% in August from a revised 1.2% in the twelve months to July, so UK house prices are still rising, just more slowly. Between July and August the monthly change was 0.3%, before seasonal adjustment. Across the whole of the UK the average sits at £273,000, a figure that has been drifting sideways for most of the year rather than climbing.
Volume matters more than the headline to a seller who needs the money out of a British home before completing abroad. HMLR counts completed sales, which typically land six to eight weeks after a deal is agreed, so August’s figures describe agreements made in early summer. On that reading the pipeline has been narrowing since spring rather than filling again. The full HPI release carries the regional tables and the revision notes.
Two technical points in the release change how the number should be read. HMLR has extended its revision period to 13 months, so this month’s figures will still move as late registrations arrive. New build and existing resold averages are not published for the two most recent months because there are not enough transactions to give a meaningful result. A September index follows on 18 November.
London flats fall 5% while the North East gains 3.2%
Gains are concentrated where prices are lowest, and the split runs along exactly the line that funds purchases abroad. London’s average property fell 2.2% over the year to £554,000, and the capital’s flats did worse: £427,000 on average, down 5% from £450,000 a year earlier. Averages for flats across England fell 2.9% to £219,000.
Regions with the smallest prices are the ones that gained. The North East rose 3.2% to £166,000 and Wales 3.1% to £216,000, while the North West added 2.2% to reach £220,000. The South East slipped 0.8% to £380,000 and the South West was flat at £304,000. Detached homes in England edged up 0.3% to £473,000.
- London: £554,000, down 2.2% on the year and up 0.7% on the month.
- London flats: £427,000, down 5%, which is £23,000 less than the average flat sold for in August 2025.
- North East: £166,000, up 3.2%, the fastest annual growth of any English region.
- Wales: £216,000, up 3.1%, with the strongest monthly move at 1%.
- South East: £380,000, down 0.8% on the year and 0.1% on the month.
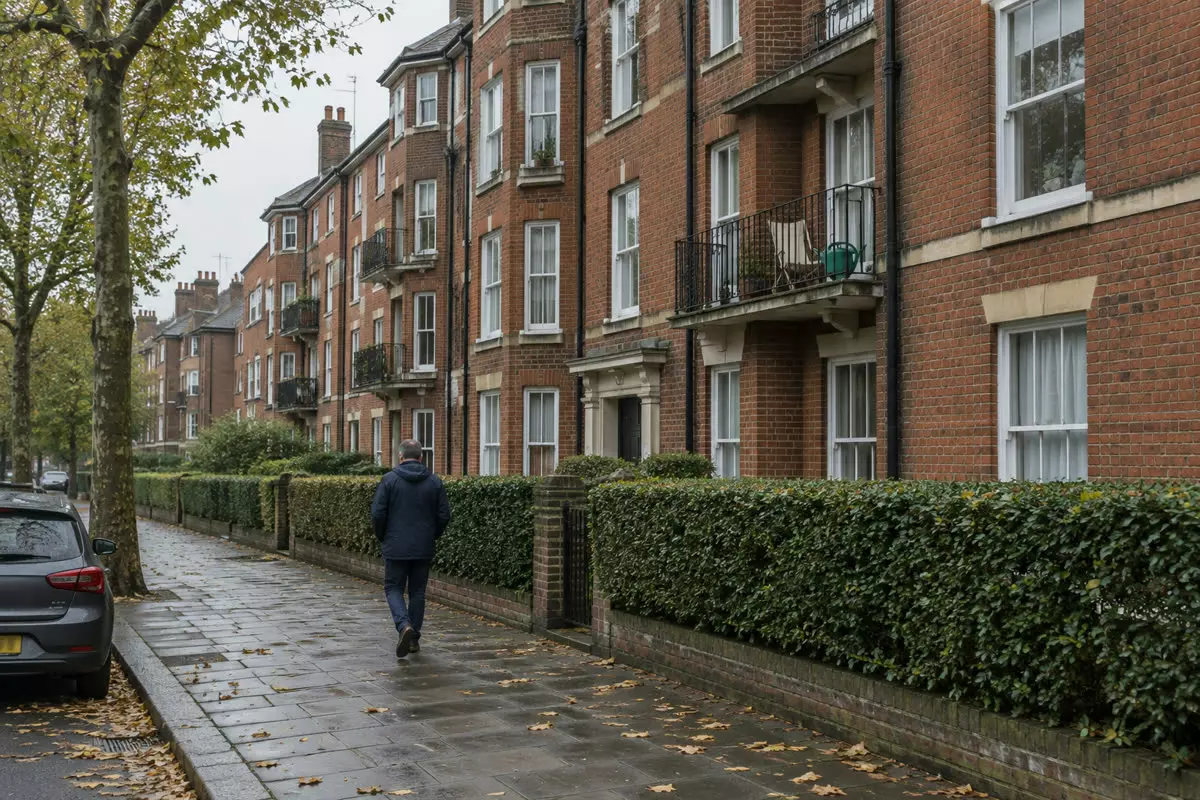
Read that as a map of who is gaining equity and who is losing it. A downsizer in a London flat is working with roughly £23,000 less than a year ago, before currency. The owner of a terraced house in County Durham or Cardiff is working with more: the North East average converts to about €197,600 and the Welsh one to about €257,100, at the rate in the next section.
Why the pound now adds 3.3% to a British sale
The European Central Bank’s reference rate put the pound at €1.1523 on 21 October 2025 and at €1.1901 on 20 October 2026, a gain of 3.3% for anyone holding sterling. On the average UK home that is worth about €10,300 more today, at an unchanged price: £273,000 converts to €324,900, against €314,600 a year ago.
Those gains are real but recent, and that matters for anyone planning a purchase next spring rather than this month. Measured on monthly averages the pound was only 1.1% stronger in August 2026 than in August 2025, so most of the move came after the summer. A reference rate is also not the rate a buyer gets: banks and currency brokers quote against it with a spread, which is why the number that counts is the one on the transfer, not the one on the screen.
A stronger pound cuts both ways, and agents with British clients in both directions should say so. It helps someone converting the proceeds of a British sale into euros. It hurts a British owner selling a Spanish or French home and bringing the money back, and it reduces the value of euro income for anyone drawing a pension from the continent.
What a British sale is worth in euros this autumn
This table converts the August averages at the ECB reference rate of 20 October 2026, and sets them against the same home a year earlier, priced from the annual change and converted at the reference rate of 21 October 2025. The last column is therefore the joint effect of the price move and the currency move, which is the number a buyer actually experiences.
| Home | August 2026 price | In euros, 20 October 2026 | In euros a year earlier | Change |
|---|---|---|---|---|
| UK average | £273,000 | €324,900 | €311,800 | +4.2% |
| London, all types | £554,000 | €659,300 | €652,800 | +1.0% |
| London flat | £427,000 | €508,200 | €517,900 | -1.9% |
| South East | £380,000 | €452,200 | €441,400 | +2.4% |
| North East | £166,000 | €197,600 | €185,400 | +6.6% |
| Wales | £216,000 | €257,100 | €241,400 | +6.5% |
Two rows are worth carrying into a client conversation. The London flat loses 1.9% in euros even after the currency gain, which is the combination a downsizer feels as “the money doesn’t go as far as I planned”. A flat anywhere in England breaks roughly even in euros, at +0.3%, because a 2.9% fall in pounds was covered by a 3.3% currency gain. For foreign buyers, the exchange rate is the second price of the house, and this year it has been the more generous of the two.
Compared with the market a British buyer is buying into, the picture is less comfortable than the pound’s headline suggests. Eurostat reported on 1 October that euro area house prices rose 4.0% in the year to the second quarter of 2026, with the wider EU at 4.7%. A British seller’s euro budget has grown 4.2% over a similar stretch. The exchange has kept pace with European prices rather than gaining on them.
What agents should tell a British seller this week
Practical work here is not predicting the rate, it is deciding who carries the risk of it. Five points cover most of what comes up with British sellers in the last quarter of the year.
- Quote the price in both currencies on the reservation document, and write down the date the conversion happens. A euro figure agreed in October and converted in January is two different numbers.
- Do the arithmetic on the buffer before the client falls in love with a property. A 3% fall in sterling against the euro cancels three years of 0.9% growth on a British home.
- Keep the local purchase costs out of the currency conversation. Transfer taxes, notary and registry fees are calculated on the euro price and do not move with the exchange rate.
- Use the right benchmark for the client. Cash purchases in England averaged £279,000 in August against £299,000 for mortgaged ones, and British buyers abroad are disproportionately cash buyers, so the cash average is usually the closer comparison.
- Leave slack in the calendar. With transactions 1.9% lower than a year ago and completions running six to eight weeks behind agreements, a Spanish completion date pinned to an assumed British sale date is the most common avoidable failure in a cross-border chain.
None of that needs a forecast. It needs the seller to know which number they are protecting, the pound figure or the euro figure, because the two have moved in different directions this year and will again.
The exchange rate bought time rather than ground
Honestly, this month’s data says that British housing is nearly flat in pounds and the currency did the work. Annual growth of 0.9% is down from 1.2% a month earlier, the monthly move was 0.3%, and sales fell both on the year and on the month. A 3.3% currency gain turned that into 4.2% more euros, and euro area prices rose 4.0%, so the average British seller is level with the market rather than ahead of it.
There is nothing in the release that argues for waiting or for hurrying. It argues for precision: knowing whether the client’s budget is set in pounds or in euros, and fixing the point at which one becomes the other. November’s index will tell us whether the slowdown in prices has continued; the exchange rate will not wait for it.
Questions British sellers are asking this month
How much is the average UK home worth in euros?
At the ECB reference rate of 20 October 2026, £273,000 converts to about €324,900. That is the UK average for August, and it is worth €10,300 more than the same price converted at the reference rate of 21 October 2025. A bank or broker will quote a slightly worse rate, so treat the figure as an upper bound.
Does the index cover Scotland and Northern Ireland?
Yes, but not on the same timetable. The UK index is built from HM Land Registry data for England and Wales, Registers of Scotland, and Land and Property Services in Northern Ireland, and the Northern Ireland figures are updated quarterly rather than monthly. New build and existing resold averages are also held back for the last two months because transaction volumes are too thin.
Is a stronger pound good news for British buyers?
For a buyer converting pounds into euros, yes: the same British sale buys more. For a British owner selling a euro property, a pension paid in euros, or a business earning in euros, it works the other way. The two groups are often the same household at different stages, which is why the conversion date deserves to be written down rather than assumed.
Did British owners gain against European prices?
Barely. The average home gained 4.2% in euros over the year and euro area house prices rose 4.0% in the year to the second quarter of 2026, according to Eurostat. That leaves the average British seller level with the market. The result varies enormously by region and property type, and a London flat owner is behind it.
Which regions gained most in euros?
The North East, at 6.6%, and Wales at 6.5%, combining price growth of 3.2% and 3.1% with the currency gain. The South East added 2.4% and London 1.0%, while the average London flat lost 1.9%. For buying property in Spain, that spread decides which British sellers can still reach the coastal market and which are now looking inland.