
Dutch private landlords are leaving the market faster than the sector can replace them. On 1 January 2026 the private rented sector held 22,000 fewer homes than a year earlier, down to 1.16 million, and private individuals alone held 37,000 fewer than twelve months before. In 2024 the whole sector had shrunk by only 3,000.
In force since 1 July 2024, the Wet betaalbare huur is the usual suspect. The figures CBS published on 3 November 2026 tell a more mixed story. This piece goes through what the numbers show, where the sales are concentrated, and what you can sensibly tell a client in each position.
What the 22,000 missing homes actually count
The headline figure is a net result, so it hides several movements that point in different directions. Private individuals held 37,000 fewer rental homes on 1 January 2026, down to 492,000, which is 7% fewer than a year earlier. In 2024 they had shed 22,000 homes, or 4%. Companies (bv and nv) held 14,000 fewer rental homes in 2025, while housing corporations added 14,000.
Other non-natural owners, such as foundations and associations, held 29,000 more. Most of that is owners changing legal form rather than homes changing hands, so it flatters the picture slightly. Owner-occupied stock grew by 81,000 homes in the same year.
Look at the two years together and the direction is clear. A net 57,000 homes moved from private individuals into the owner-occupied sector over 2024 and 2025. A net 12,000 moved from private individuals to non-natural owners: companies, corporations and other organisations. Newbuild, demolition and conversions added a net 9,000 homes to the private individual stock, so sales are the dominant force but not the only one.
Homes that left were not the weakest ones. They had an average WOZ value of 375,000 euro, against 327,000 euro for all privately rented homes, and they were more often single-family houses, larger and newer than average. That matters for anyone assessing the rental market, because the stock being lost is the family-sized end of it.
Why the rent law is only one of the causes
The Wet betaalbare huur ties the maximum rent to the quality and size of the home through the points system (woningwaarderingsstelsel), which already applied to social housing, and extends that logic to the middle segment, as Volkshuisvesting Nederland sets out. A landlord could once ask 1,600 euro a month for a draughty two-room flat; the maximum now follows the points.
The law is one cause among several, and it did not carry the most weight. Mathijs ten Broeke, spokesperson for the Woonbond, says the law does what it was meant to do, with lower and fairer rents, and adds that the fiscal rules hit returns much harder than the rent cap itself. Box 3 and the mortgage rate decide the return long before investors exit, and the sales of the past two years followed that arithmetic rather than the points system. Higher mortgage rates add to this: Dutch mortgage rates rose through the autumn of 2026 and confidence in the housing market fell in November. The earlier wave of investors leaving ran on the same logic.
Opinions differ on what follows. Aedes says the law restores the link between price and quality and gives corporations clarity to build for middle incomes. Nathalie Nuiten of Aedes says investors need investment capacity from other fiscal rules, without loosening affordability for tenants. Professor Peter Boelhouwer warned before the law that households which cannot buy and do not qualify for social housing fall between the cracks, and that landlords need a modest return to keep supply standing.
If you advise on a Dutch rental purchase, a simple three-step check keeps surprises down:
- Find the points count and the resulting maximum rent for the specific home.
- Compare the current or planned rent with that maximum, including any starting rent a tenant could still challenge.
- Rebuild the return after tax and current mortgage costs, not on the old rent.
Where the sell-off hits hardest in the Randstad
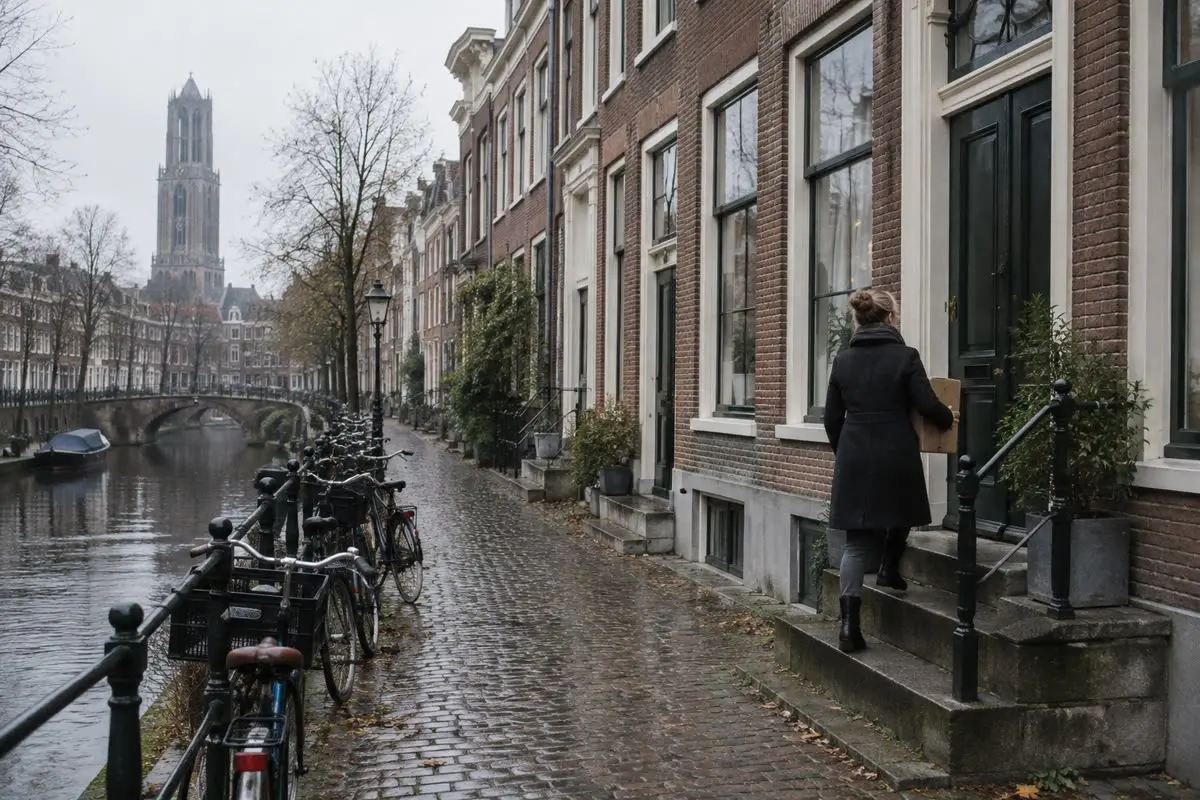
Geography is where the story becomes practical. Over 2024 and 2025 together, the share of private rental homes that became owner-occupied was highest in Utrecht province at 13.5%, followed by Noord-Holland at 12.6% and Zuid-Holland at 11.3%. Flevoland stood at 10.7%, and Gelderland at 9.7%. These are the provinces where demand for owner-occupied homes is deepest and where a seller is most likely to find a buyer.
In the four big cities the order is the same. Utrecht led at 15%, Amsterdam came next at 12%, and Rotterdam and The Hague both reached 11%. Anyone looking at a rental home in the Randstad should expect a thinner pool of private rentals than a few years ago, and a market that is tightening for tenants.
Further out the shares are lower. Limburg had the smallest share at 6.3%, with Zeeland at 7%, and Overijssel, Fryslân and Groningen between 8.1% and 8.2%. That gap suggests the sell-off follows resale demand more than regulation, since the same national rules apply everywhere. Where owner-occupied buyers are plentiful, landlords can cash out. Where they are not, they stay or find it harder to leave.
For an agent, the practical reading is that a Dutch owner in Utrecht or Amsterdam has the easiest exit, while an owner in Limburg may wait longer. Dutch house prices matter in that calculation, because a higher sale value is what makes an exit worth taking. A foreign buyer, in turn, will find more competition for a home that has just left the rental stock, because owner-occupiers are the main buyers. The September price figures show where that market stood.
The numbers behind the private rental sell-off
A short table makes the regional spread easy to compare. The shares show how much of the private rental stock became owner-occupied over 2024 and 2025 together.
| Province | Private rentals sold to owners |
|---|---|
| Utrecht | 13.5% |
| Noord-Holland | 12.6% |
| Zuid-Holland | 11.3% |
| Gelderland | 9.7% |
| Limburg | 6.3% |
The table shows five provinces, but the full list runs wider, from Flevoland at 10.7% to Zeeland at 7%. It is consistent: the western and central provinces lose the most, and the periphery loses the least.
In the four big cities, the rates were 15% in Utrecht, 12% in Amsterdam, and 11% each in Rotterdam and The Hague. Utrecht stands out at the top both as a province and as a city. Across the whole country, the private individual stock stood at 492,000 homes on 1 January 2026, so a net 57,000 moved to owner-occupation in two years is a large share of what remains.
The Huurcommissie, the rent tribunal, handled 1,756 requests from tenants to test their starting rent in all of 2025, and 1,452 so far in 2026. Tenants are using the route the law created.
What agents should tell buyers and landlords
Advice depends on who is in front of you, but a few points hold across the board. Keep the conversation anchored in the numbers above rather than in headlines about the law, because the data points to several causes.
- Landlords weighing a sale: a home that is larger, newer or a single-family house matches what owner-occupiers are buying, and those are the homes that have been leaving the rental stock.
- Landlords weighing a hold: run the return on the points-based maximum rent, with current mortgage costs and the fiscal rules included, not on past rents.
- Foreign buyers looking at a tenanted home: ask for the points count, the current rent and any record of a Huurcommissie request, and check the starting rent has not been challenged.
- Foreign buyers looking at vacant homes: expect competition from domestic owner-occupiers, especially in Utrecht, Noord-Holland and Zuid-Holland.
- Investors comparing countries: treat the Netherlands as a market where regulation, tax and interest rates all move the return, and weigh each against what you would face in Spain, Portugal or Germany.
None of this depends on a forecast. It depends on checking the specific home, the specific rent and the specific owner’s costs before anyone commits.
A market that rewards patience over speed
The Dutch picture is not a simple story of regulation pushing owners out. The rent law changed the maximum rent, but tax treatment and higher interest rates carried more weight, and the data shows sales concentrated where owner-occupied demand is strongest. That is a useful corrective if a client has read a one-line explanation somewhere.
For a seller, patience can pay if the home does not fit the profile buyers want. For a buyer, a slower and more careful search will usually turn up better information than a quick one, especially on a tenanted property. For a landlord weighing a stay, the question is whether the return holds up under today’s rules and today’s costs.
Pressure on supply is the part to keep watching. Corporations added 14,000 rental homes in 2025, yet the private sector still shrank, and households in the middle remain the ones most exposed. As landlords exit, the people who rent do not disappear, so that gap is likely to stay in the conversation for as long as these numbers hold.
Questions agents ask about the Dutch sell-off
How many rental homes did the Netherlands lose in 2025?
The private rented sector shrank by 22,000 homes to 1.16 million on 1 January 2026. Private individuals sold 37,000 homes, while other owner groups partly offset the drop.
Did the rent law cause landlords to sell?
It is one cause among several. The Woonbond says fiscal rules hurt returns more than the rent cap, and higher interest rates added pressure. Data does not isolate the law as the single driver.
Which areas lost the most private rentals?
Utrecht province led at 13.5% over 2024 and 2025, followed by Noord-Holland at 12.6% and Zuid-Holland at 11.3%. Among cities, Utrecht reached 15% and Amsterdam 12%.
What kind of homes left the rental stock?
They were more often single-family houses, and larger and newer than average. Their average WOZ value was 375,000 euro, against 327,000 euro for all privately rented homes.
Can tenants challenge their rent?
Yes. The Huurcommissie handled 1,756 requests to test the starting rent in 2025 and 1,452 so far in 2026, which shows tenants are using the route.