

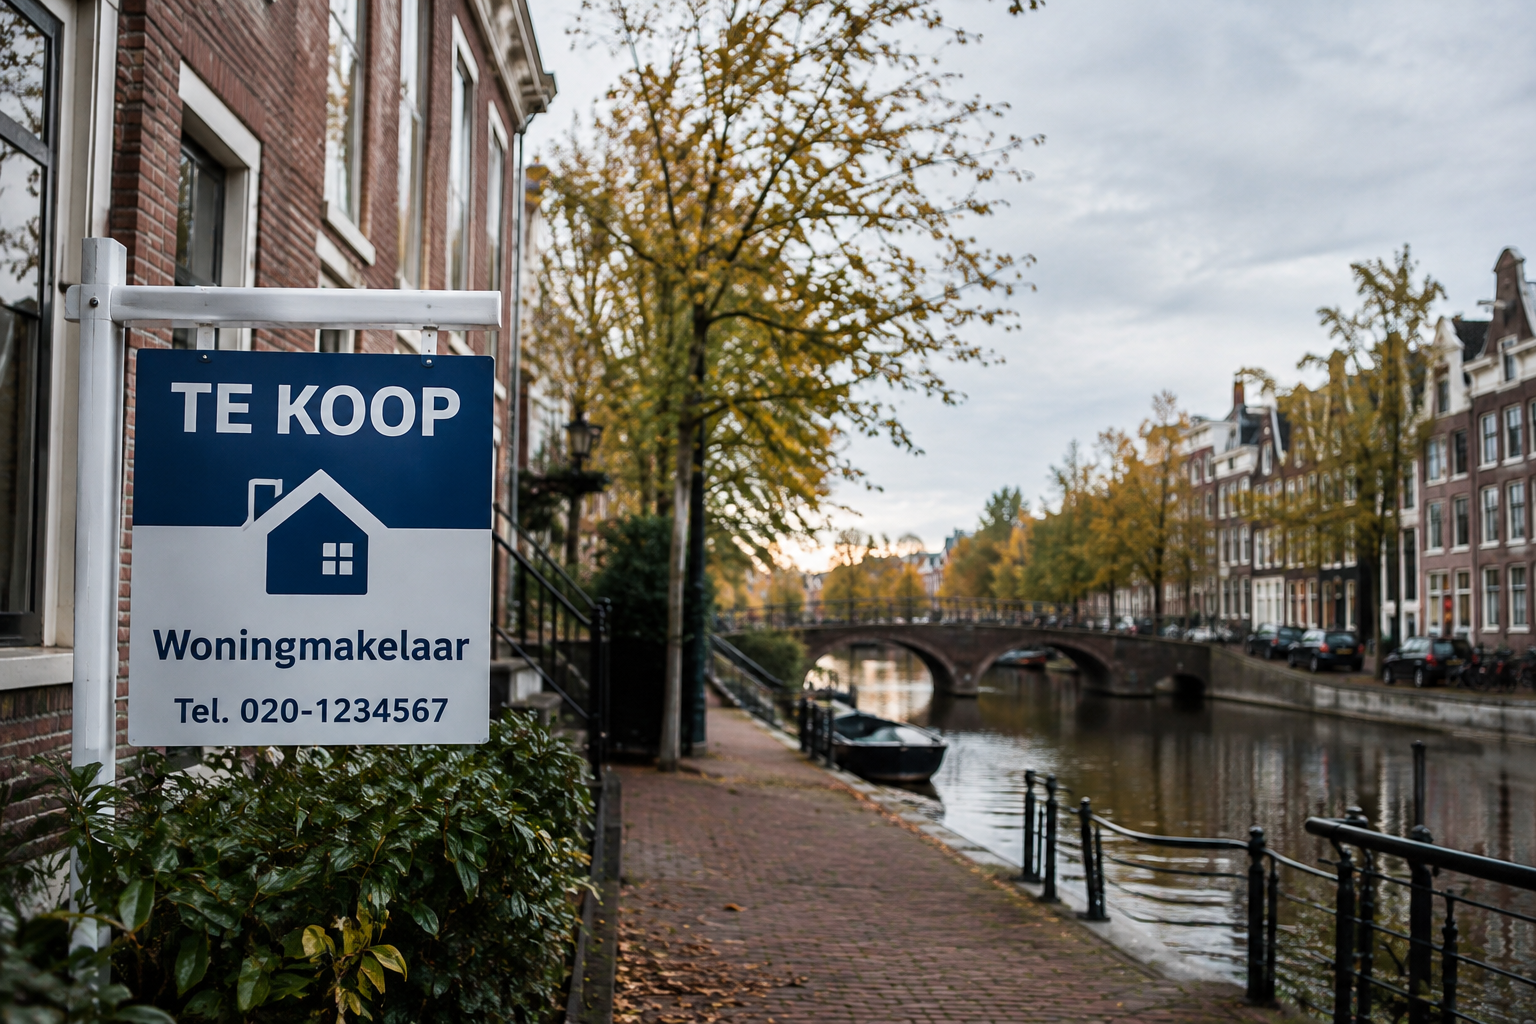
The Dutch property market, long known for its relentless price growth, appears to be entering a new phase. Fresh data pointing to the second quarter of 2026 shows that six municipal councils across the Netherlands have recorded measurable drops in average house prices, a signal that may indicate broader cooling across the national housing sector. For years, buyers in cities like Amsterdam, Utrecht, and Rotterdam battled bidding wars and record-breaking valuations, but the tide seems to be turning in select regions. This article breaks down what is happening, why it matters, and which areas are feeling the biggest impact.
Dutch Housing Market Shows Signs of Cooling
After nearly a decade of near-uninterrupted price increases, the Netherlands housing market is showing early but consistent signs of deceleration. According to figures referenced from national housing trend reports, average transaction prices in several councils have started to plateau or decline slightly for the first time since the post-pandemic recovery period. This shift follows a prolonged stretch of affordability concerns, where first-time buyers were increasingly priced out of urban centers and forced to look toward smaller towns and rural municipalities.
Analysts tracking the market through sources like CBS (Statistics Netherlands) note that while national averages remain elevated compared to five years ago, the rate of growth has clearly slowed. Mortgage rate pressures, tighter lending criteria, and a gradual increase in housing supply are being cited as contributing factors. Rather than a dramatic crash, experts describe this as a natural market correction, one that could bring some much-needed relief to buyers who have been locked out of homeownership for years.
Six Councils Report Notable Price Declines
The most striking element of the Q2 2026 data is the identification of six specific councils where price declines were significant enough to stand out from the national trend. These municipalities span different regions of the country, suggesting the cooling trend is not confined to a single province or economic zone. Instead, it appears to reflect a mix of localized oversupply, shifting buyer demand, and broader affordability constraints playing out simultaneously in different pockets of the Netherlands.
While exact percentage drops vary by council, the common thread among all six areas is a slowdown in buyer competition compared to the frenzied market conditions seen in previous years. Housing agencies and local real estate bodies affiliated with the NVM (Dutch Association of Real Estate Agents) have observed longer listing times, more room for price negotiation, and a noticeable dip in the number of homes selling above asking price. This marks a departure from the seller’s market that has defined Dutch real estate for much of the last decade.
What’s Driving the Q2 2026 Market Shift
Several intersecting factors appear to be behind this cooling trend, and understanding them helps explain why certain councils are affected more than others. Below is a breakdown of the primary drivers:
- Rising mortgage interest rates – Higher borrowing costs have reduced purchasing power for many prospective buyers, particularly first-time buyers and younger households.
- Increased housing supply – New construction projects in several municipalities have added inventory to the market, easing the scarcity that once fueled aggressive price growth.
- Tighter lending regulations – Dutch banks and mortgage lenders have adjusted loan-to-income ratios, making it harder for buyers to qualify for the loan amounts needed to compete in previously hot markets.
- Shifting demand patterns – Remote work flexibility continues to influence where people choose to live, with some buyers moving away from expensive urban councils toward more affordable regions, which paradoxically cools demand in the pricier areas.
- Economic uncertainty – Broader macroeconomic concerns, including inflation and cost-of-living pressures, have made some buyers more cautious about committing to large property purchases.
Together, these factors have created a more balanced market environment, at least in the six councils highlighted in the Q2 2026 report. It is worth noting that this cooling does not necessarily indicate a market downturn in the traditional sense. Instead, it looks more like a rebalancing after years of unsustainable growth. Data from Kadaster, the Dutch land registry office, has historically shown that such corrections tend to unfold gradually rather than abruptly, giving both buyers and sellers time to adjust expectations.
Regional Breakdown: Where Prices Fell Most
The six councils reporting the steepest declines represent a geographically diverse cross-section of the Netherlands, ranging from mid-sized urban centers to smaller commuter towns. While specific figures fluctuate depending on the reporting source, the general pattern shows that areas which experienced the fastest price growth in prior years are now seeing the most noticeable corrections. This is a common pattern in real estate cycles, where overheated markets tend to cool more sharply once demand softens.
The table below offers a simplified comparison of the type of price movement patterns typically seen across these affected councils, based on the trends described in the Q2 2026 report:
| Council Type | Typical Price Trend (Q2 2026) | Likely Contributing Factor |
|---|---|---|
| Urban commuter towns | Moderate decline | Increased supply, mortgage rate sensitivity |
| Mid-sized regional councils | Slight decline | Slower buyer demand, longer time on market |
| Former high-growth hotspots | Sharpest decline | Correction after rapid prior appreciation |
| Rural or peripheral councils | Minimal change | Lower price base, steady demand |
This breakdown illustrates that the cooling effect is not uniform. Councils that saw the fastest appreciation during the 2020 to 2024 boom years appear to be experiencing the most significant pullbacks now, while more stable, lower-growth regions are largely holding steady. For potential buyers, this creates a more nuanced landscape where location-specific research is more important than ever before, since broad national averages can mask significant differences between individual municipalities.
In Short
The Q2 2026 data paints a picture of a Dutch housing market that is finally showing signs of moderation after years of sustained price growth. Six councils have reported measurable price declines, driven by a combination of rising mortgage rates, increased housing supply, tighter lending standards, and shifting buyer preferences. While this does not signal a market collapse, it does suggest a meaningful shift toward a more balanced environment, one where buyers may finally regain some negotiating power after years of intense competition.
For those watching the market closely, whether as potential buyers, sellers, or industry professionals, the key takeaway is that regional variation matters more than ever. National trends can offer a general sense of direction, but the real story lies in how individual councils are responding to changing economic conditions. As always, staying informed through reliable sources remains the best strategy for navigating a housing market in transition.
FAQ
1. Why are house prices dropping in some Dutch councils in 2026?
Price drops are largely attributed to rising mortgage interest rates, increased housing supply, tighter lending regulations, and softer buyer demand in previously overheated markets.
2. Does this mean the entire Netherlands housing market is crashing?
No, the data suggests a cooling or correction rather than a crash. Six specific councils showed notable declines, while other regions remained relatively stable.
3. Which types of areas are seeing the biggest price declines?
Former high-growth hotspots and urban commuter towns appear to be experiencing the sharpest corrections, largely because they saw the fastest price increases in prior years.
4. Is this a good time to buy a house in the Netherlands?
It depends on the specific council and personal financial circumstances. Buyers may find more room for negotiation in cooling markets, but mortgage rates remain an important factor to consider.
5. Where can I find reliable Dutch housing market data?
Official sources such as CBS, Kadaster, and the NVM regularly publish housing market statistics and trend reports for those seeking up-to-date information.

Join The Discussion